● CAPABILITIES
Visualize how the layout performs under agent activity.
Animated 3D playback, heatmaps, and spatial performance across visibility, connectivity, and flow.
Agent Journey Mapping
Quantify the experience and choices of every patient and provider.
Journey timelines, experience scores by archetype, and time-in-space breakdowns.
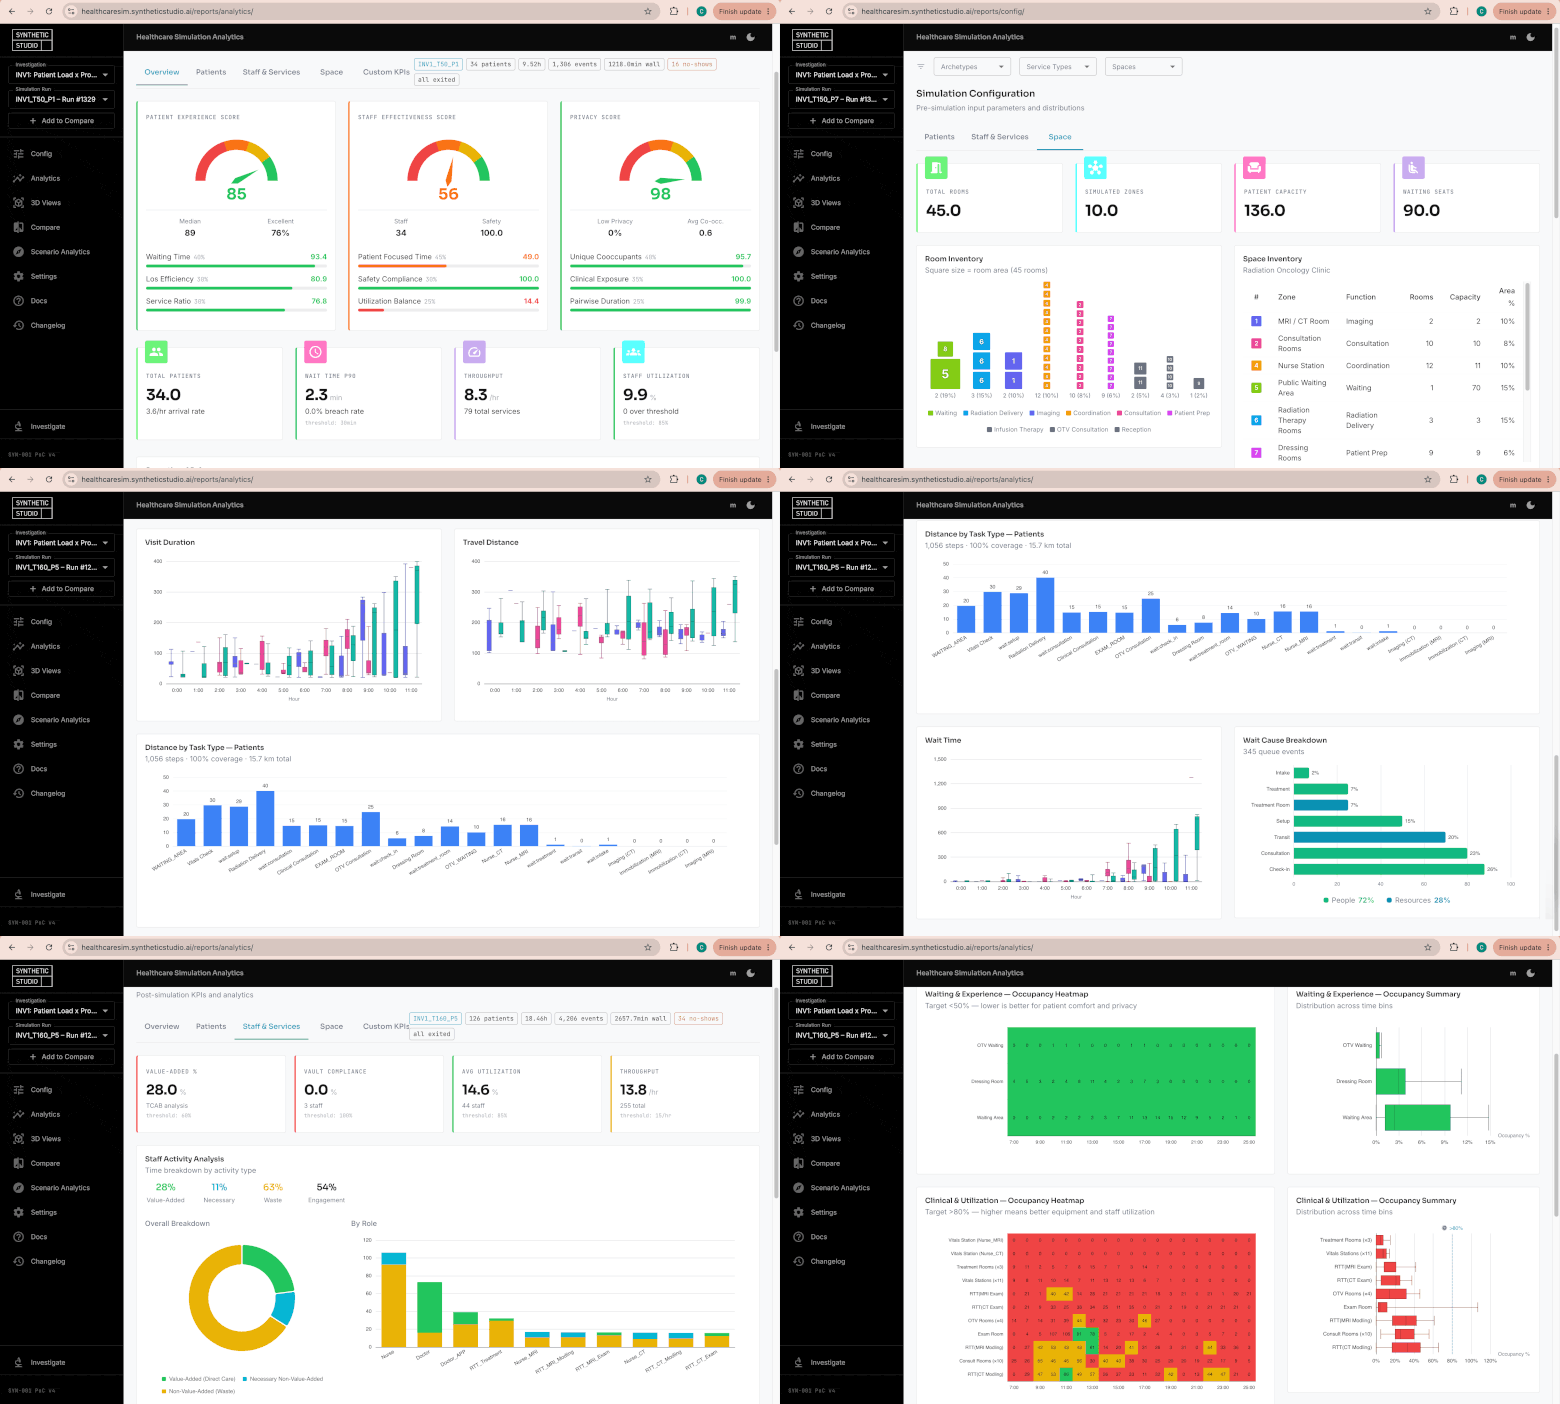
Scenario Dashboard
Track ecosystem performance through experience, operations, and design lenses.
KPI tracking, comparison views, and drill-down analytics
● OUR BELIEF
Every operational and design choice exists to shape human experience. The behaviors that follow are what actually drive service performance.
TASK PATH
SIMULATED BEHAVIOR
People move, decide, and interact based on their goals, familiarity, and preferences. Modeling those differences reveals the pathways and pressure points that service decisions actually depend on.
Left: what task diagrams assume. Right: what agents actually do.
● TECHNOLOGY
THE SIMULATION ENGINE
Cognitive agents carry identity, memory, goals, and relationships. Each one perceives the room, decides, and acts. Nothing is scripted: behavior and experience emerge, the way they do in real life.
Thousands of runs across hundreds of scenarios.


THE SYNTHETIC DASHBOARD
One synchronized view across experience, operational, and design KPIs. Shift the lens from a single journey to whole-floor patterns without changing the model. Every number traces back to simulated moments.
Evidence you can interrogate, not a black box.


● APPLICATIONS

